
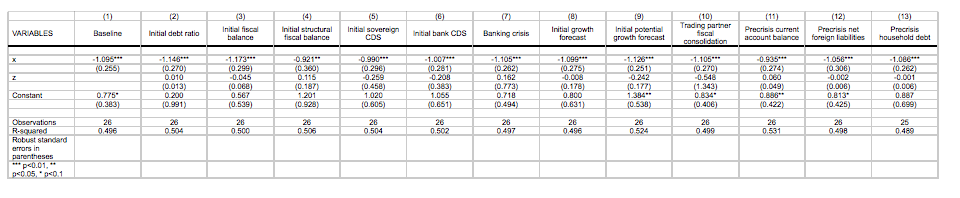
A recent influential paper by Blanchard and Leigh 2013 investigates the relation between growth forecast errors and planned fiscal consolidation during the recent financial crisis. They find that fiscal multipliers were substantially higher than those implicit in the models used by forecasters. Blanchard and Leigh also check if their results are robust to controlling of additional variables that could have possibly triggered both planned fiscal consolidation and lower-than-expected growth. The list of control variables is comprehensive and includes the initial debt ratio, the initial fiscal balance, the initial structural fiscal balance, the initial sovereign CDS, the initial bank CDS, a banking crisis dummy, the initial growth forecast, the initial potential growth forecast, the trading partner fiscal consolidation, the pre crisis current account balance, the pre crisis net foreign liabilities and the pre crisis household debt. Table 1 reproduces their baseline results for a sample of 26 european countries in 2011. The baseline coefficient is closed to -1 and is barely influenced by the inclusion of any of the controls. Remarkably none of the controls appears to be statistically significant. (click to enlarge)

They are calculated as the ratio of total income received by respectively the 25%,20%,10%,5%,1% of the population with the highest income to that received by the 25%,20%,10%,5%,2% of the population with the lowest income. All income measures are initial (end-2009) equivalized disposable income .(The equivalised disposable income is the total income of a household, after tax and other deductions, that is available for spending or saving, divided by the number of household members converted into equalised adults; household members are equalised or made equivalent by weighting each according to their age, using the so-called modified OECD equivalence scale.) and are shown in Figure 1. (click to enlarge)

The coefficient on the consolidation forecast does not change, so that the results of Blanchard and Leigh still hold. However the coefficients on the controls are statistically significant and fairly large. Take for example the income quartile share ratio. The average income quartile ratio across the 26 countries in the sample is approximately equal to 4 implying that the 25% percent with higher income has on average 4 times the income of the 25% with lower income. The estimated coefficient on the income quartile share ratio implies that an increase from 4, Switzerland, to 5, Portugal, would lead to a domestic output loss of -0.93% larger relative to forecast in Portugal relative to Switzerland. This is of the same order of magnitude of the underestimation of the multiplier. Figure 2 collects the coefficients together with the 95% confidence intervals. (click to enlarge)

Recall that the controls are initial period value (end-2009) so that the causality is likely to go from distribution to growth forecast errors. Given that most of the countries in the sample have experienced a recession, the negative and significant coefficient on the income distribution measures is suggestive of standard Keynesian channels if the income distribution proxies for share of households that are credit constraints and/or have higher marginal propensity to consume. In any case further analysis must be performed to better interpret the results.
Are you searching for a very genuine loan at an affordable interest rate of 3% process and approved within 4 working days? Have you been turned down Constantly by your Banks and other financial institutions because of bad credit? Loans ranging from $5000 USD to $20, 000, 000 USD maximum LOANS for Developing business a competitive edge / business expansion. We are certified, trustworthy, reliable, efficient, Fast and dynamic for real estate and any kinds of business financing. Contact us for more details and information.
ReplyDeleteThanks & Regard
Call/Whats App 918929509036
(Whats App) 918929509036
Dr James Eric Finance Pvt Ltd
E-mail: financialserviceoffer876@gmail.com